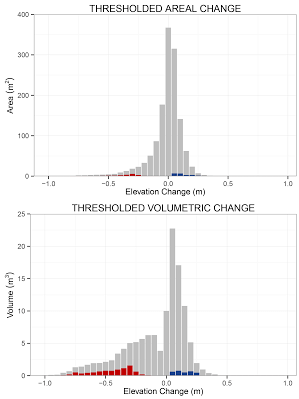
Simply Customize Elevation Change Distributions in Excel
If you don’t like how the elevation change distribution graphics are produced by GCD, simply open up the threshold.csv and raw.csv files in your output folder and copy the contents of the volume column into the ECD.xlsxexcel file below. You’ll need to make sure you put the right values in the right places and then recalculate some of the files, but you will then be able to customize the size and layout of the fonts, bars, colors, sizes etc. You can of course do this in excel manually, but the template below is formatted to have a similar appearance to what you see in GCD.
Fancier Elevation Change Distributions Plots in R
If you want to make more customizable and professional elevation change distribution plots in R, see the two scripts in:
ECDplots_R.zip
What does the script(s) output?
- ECD plots as a *.pdf. These can be further customized using a graphics drawing program (e.g. Adobe Illustrator) or simply saved as a *.png to use in a report, etc.

What’s in the *.zip?
- Script to produce Simple DoD ECD plots (GCD_SimpleMinLoDBarplots_v2.R)
- Script to produce Thresholded DoD ECD plots (GCD_ThresholdedBarplots_v2.R)
- Example data (raw.csv; thresholded.csv)
Who should use these scripts?
- Anyone with a very basic working knowledge of R (i.e. you’ve figured out how to install and open the program!)
What do I need to do to run the script?
- Watch the step-by-step video posted below, or follow these simple steps:
- Step 1: Open the script in R
- Step 2: Define necessary ‘user-defined arguments’ (differs based on script you choose to run)
- Step 3: Highlight all the code and run!
