GCD Viewer
The GCD Viewer is an AddIn for ArcGIS Pro. It can display GCD data cartographically in ArcGIS using curated symbology and map table of contents. GCD Viewer is read only. It does not include any GCD operations. It's sole purpose is for viewing GCD data. Use the GCD Standalone to perform operations and the viewer to visualize the results in a map.
Toolbar / Ribbon
After installing the GCD Viewer you should see a GCD option along the top of ArcGIS Pro to open the GCD toolbar / ribbon. This toolbar contains all key operations that you can perform with the GCD Viewer.
Open Project
Click the open project button to browse to the location of an existing *.gcd project file. After you select the file, the GCD dockable panel should open on the right displaying the contents of the GCD project.
Reload Project
Click the reload project to re-read the GCD project file and update the project tree in the dockable panel. This is useful if you make changes to the currently open GCD project and want to see them reflected in the GCD Viewer. A typical workflow is to add a new DEM Survey in GCD Standalone then click Reload Project in the GCD Viewer and finally double click the new DEM Survey to add it to the current map.
Data Exchange
The Riverscapes Data Exchange is a free platform for storing, discovering and viewing geospatial data. Starting with GCD 7, all GCD projects are compatible with the data exchange. If the currently open project was downloaded from the data exchange, clicking this button will open your default web browser at the data exchange details for this project.
Close Project
Clicking this will close the currently open GCD project.
Sofware Help
Clicking this will launch your default web browser at this, the GCD online software help site.
About GCD
Clicking this will show the about screen displaying the current GCD version as well as links to support resources.
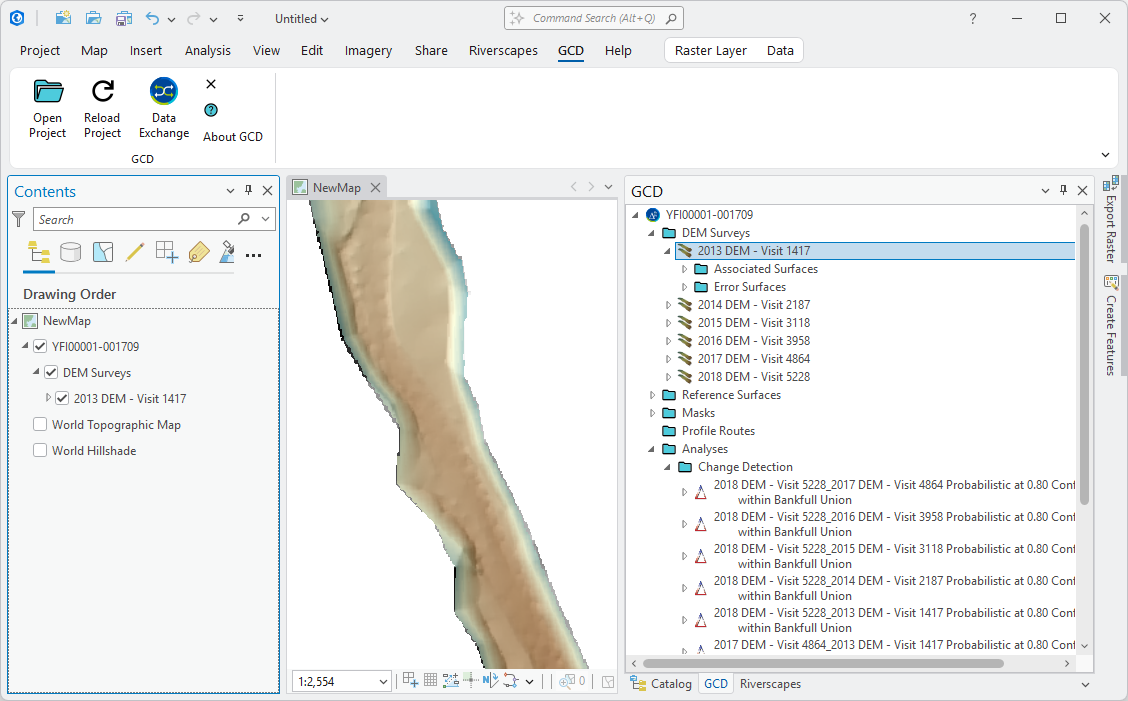
Project Explorer
The project explorer dockable panel shows the content of the currently open GCD project. It's a stripped down version of the version that appears in the GCD Standalone. Double clicking spatial datasets will add them to the current map, or open a new map if one is not already open. Some datasets, such as DEM Surveys and DoDs have additional menu options for displaying custom symbology.
Scaled Symbology
New to the GCD Viewer is the ability to scale the symbology for a dataset to the data range for all rasters of the same type. For example, you can add any DEM Survey to the map using a color ramp stretched to the maximum data range of all DEM Surveys in the project. Similarly, you can add any DoD to the map stretching the symbology over the data range of all DoDs in the project. This is useful for ensuring that you are always viewing data using the same colour ramp. In other words, shades of the same colour will always represent the same pixel value in all rasters when using this feature.